




Interactive Maps Improve Public Access to Information
In Brief
Empowering Mat-Su Borough with GIS Innovation
Matanuska-Susitna Borough, (or Mat-Su Borough (MSB)), one of the fastest-growing counties in Alaska, wanted to make geographic and planning data more accessible to its citizens. As part of our two decade-long partnership with MSB, we worked collaboratively with MSB’s GIS team to achieve an impressive gallery of 35 interactive, online, public-facing maps and apps.
The apps provide tools for land use planning, infrastructure issue reporting, facility reservations, and more. These solutions have strengthened citizen’s decision-making processes, lessened administrative burden on the borough, and enhanced public engagement—garnering thousands of views across the apps since inception.
Key Takeaways
Interactive Mapping Apps Support a Growing Population
-
Easy geographic information access for faster decisions
Mat-Su Borough transitioned from a file-based GIS approach to dynamic, interactive maps that improve decision-making for residents and officials alike.
-
Automation for simplified government operations
Digital tools such as the Citizen Problem Reporter and Facility Reservations Map have automated manual processes for staff and citizens, saving time and resources.
-
Online mapping tools for enhanced public engagement
More than 30 new mapping tools provide transparency, allowing the public to easily access critical data about land use, planning, recreational facilities, and more.
-
Resilient GIS ecosystem for future-readiness
A strategic and well-structured approach to GIS management has equipped MSB with a powerful suite of GIS tools, ensuring they are ready to support their growing population.
Meet Our Client
Matanuska-Susitna Borough, Alaska
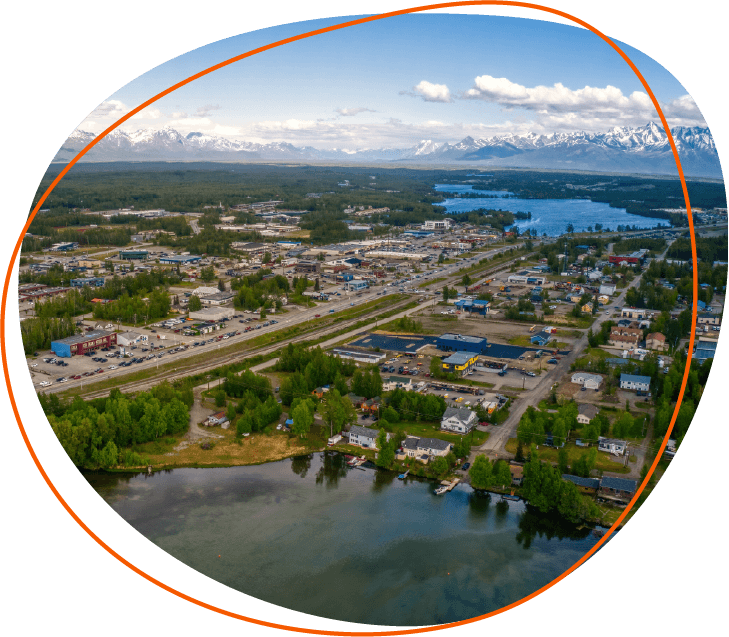
Matanuska-Susitna Borough (Mat-Su Borough or MSB) spans nearly the size of Ireland and serves over 250,000 residents, managing essential municipal services from planning to recreation. For two decades, Resource Data has helped MSB integrate systems, implement e-commerce solutions, enhance security, and even recover from a ransomware attack. Our partnership helps MSB remain technologically advanced, efficient, and resilient.

Challenges
Overcoming siloed systems for easier public access
Previously, MSB’s GIS data was siloed in a file-based GIS data management system. If a member of the public needed GIS data from MSB, they would need to submit a formal request and pick up the data from MSB headquarters—which could be an hours-long drive in the spacious borough.
MSB staff also needed to take time to gather and prepare the requested data for the requestor. Moving to a web-based GIS system via a set of online, interactive web maps allows the public to conveniently access MSB’s GIS data from their home computers. It also enables MSB to collaborate across their entire business, allowing even non-GIS borough staff the ability to access the data.

Solutions
A Comprehensive Approach to GIS Modernization
As part of their enterprise licensing agreement with Esri, MSB received an assessment to see how they could use location and GIS data to bring value to the business. Esri helped MSB identify a portfolio of around 90 potential web maps that could benefit the borough.
Resource Data supported the borough with initial planning and first steps for modernizing their GIS systems in order to start building the web maps. We helped them execute the scoping for their Enterprise environment, conduct data inventory and data planning to move their file-based GIS data to new Enterprise geodatabases, and install and configure their portal.
We also helped them decide which of the solutions to create through a decision-tree process—a scoping and design flow in which we collected information to feed certain selection criteria to determine on the requirements and product selection. Examples of criteria included determining whether spatial data for the map was already available and ready to use, identifying functional and business requirements, determining the strongest needs among the borough’s departments, and analyzing integrations or system dependencies for the target solution.
MSB’s in-house GIS development team executed the core builds for most of the apps, and Resource Data contributed project management, design, and GIS development services to support their team.
Planning and Land Use Viewer
Centralizing access to property regulations
Previously, navigating zoning and land-use regulations in the MSB was a difficult process. Property buyers and developers had to consult multiple sources, making it difficult to assess regulatory constraints, service areas, and environmental factors affecting property use.
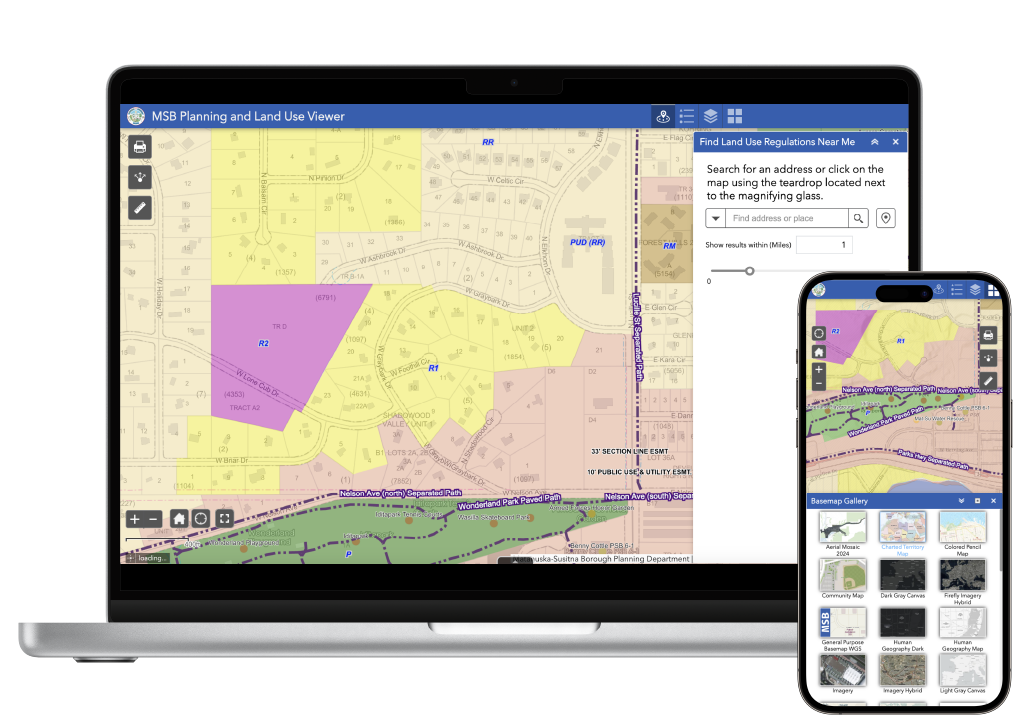
MSB partnered with Resource Data to design an interactive ArcGIS Online-based tool consolidating zoning, service areas, and regulatory overlays. The map viewer displays critical factors such as zoning classifications, fire service areas, flood zones, school districts, wetlands, and city boundaries. Additionally, it links directly to borough codes and external regulations, simplifying compliance for homeowners, businesses, and developers.
Resource Data designed the application architecture, managed the project, and facilitated cross-department collaboration, while MSB’s GIS team developed the mapping component. The result is one of the borough’s most used GIS tools, with tens of thousands of accesses since launching.
Aerial Imagery Viewer
Making high-res aerial imagery publicly available
Maintaining up-to-date aerial imagery is critical for property assessment, environmental monitoring, and planning in the MSB. When a key staff member retired, a gap emerged in managing this essential program. Resource Data stepped in to oversee the borough’s imagery acquisition process, drafting RFPs, and managing the awarded vendor. We ensured high-resolution images were captured under optimal conditions—balancing snow coverage and vegetation growth—while implementing rigorous QA/QC processes to verify accuracy and correct issues like blurring or warping.
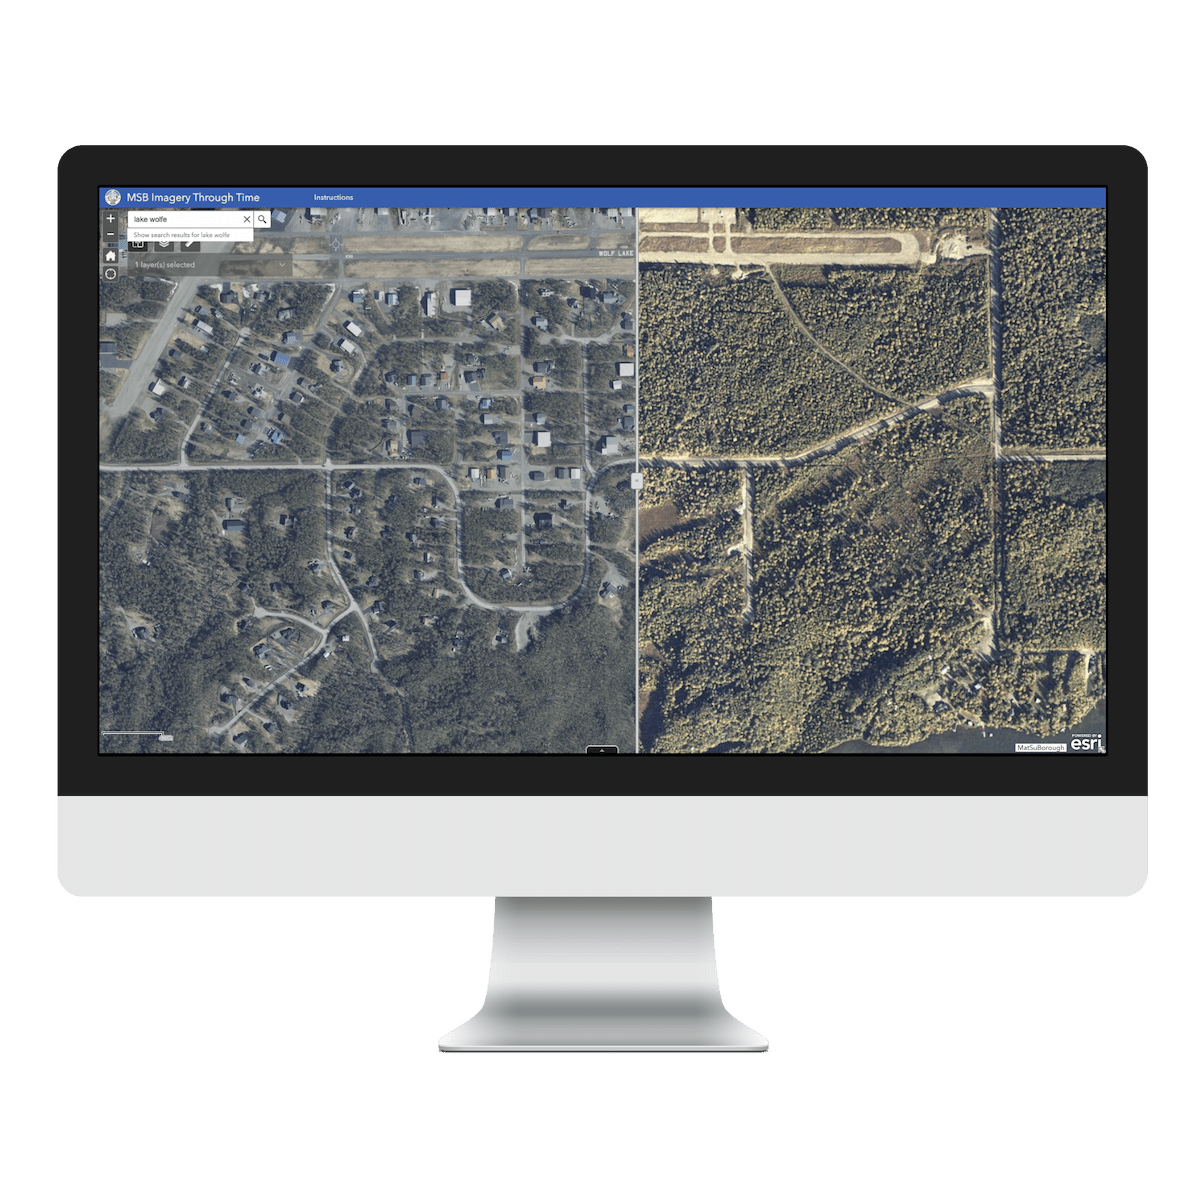
To enhance public access, we updated an interactive imagery viewer, allowing residents to compare land imagery from 1945 to the present using a swipe tool. The platform also enables the purchase of aerial imagery and Light Detection and Ranging (LiDAR) data, supporting city planners, property owners, and environmental researchers. Since its release, the viewer has logged over 8,700 visits, cementing its role as a long-term municipal asset for informed decision-making and historical land analysis.
Facility Reservations Maps
Simplifying the reservations process
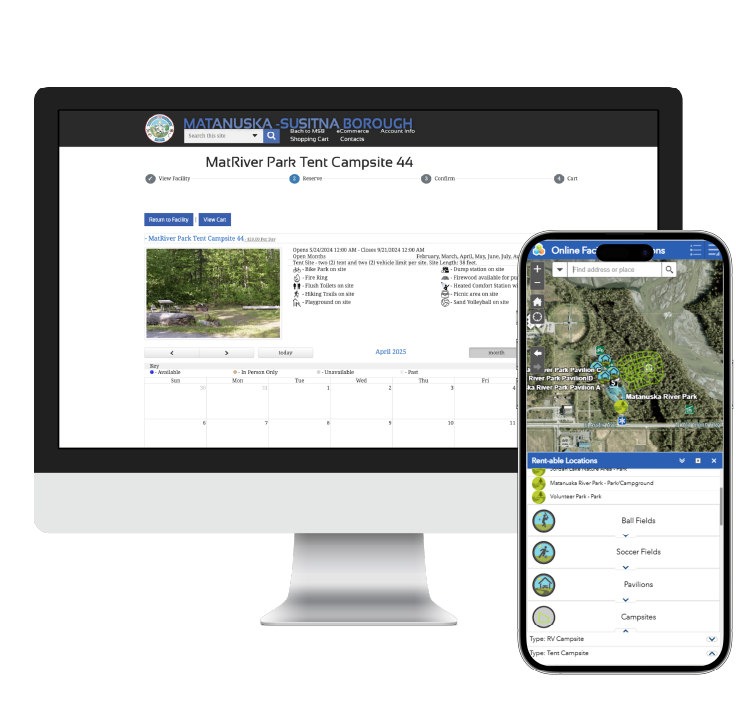
For Mat-Su Borough residents, reserving a community facility like a pavilion or campsite once required multiple steps, sometimes including in-person visits to Borough headquarters—a significant inconvenience in a region where travel times can reach three hours.
To overcome this challenge, the borough partnered with Resource Data to develop a digital reservation system integrated with GIS technology. This tool allows residents to visually explore locations and facilities on an interactive map before booking them. The map shows images and amenity details for pavilions, ball fields, and campsites. Once a resident selects a location, the app seamlessly transitions to an online reservation system.
By integrating GIS and e-commerce functionality, reserving public spaces is now much more accessible and convenient. The system has also reduced administrative workload and simplified facility management for the Borough.
Citizen Problem Reporter
Speeding up problem-reporting in the Borough
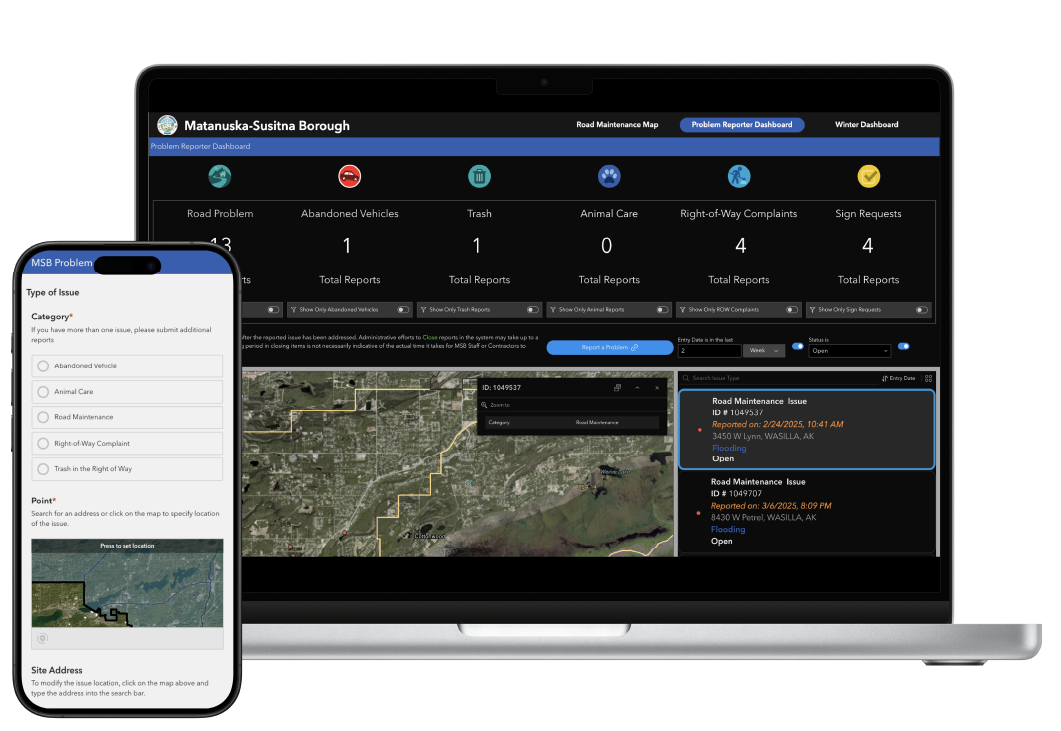
Harsh Mat-Su Borough winters bring heavy snow, icy roads, and ongoing maintenance challenges. Previously, residents had no centralized way to report issues like potholes, blocked roads, or abandoned vehicles, making it difficult for officials to track problems and coordinate repairs. To solve this, Resource Data supported Mat-Su Borough in its development of the Citizen Problem Reporter, a web-based system allowing residents to submit location-based reports on issues ranging from fallen trees to illegal dumping.
The system dynamically adjusts forms to capture relevant details. It integrates directly with the borough’s internal work order system, enabling faster response times to problems, and a public dashboard allows residents to track the status and timeline of reported issues. In addition, plowing updates and road conditions are also available through the reporter. Since its launch, the tool has logged 5,000+ views, improving communication between residents and the borough while enhancing service efficiency.
Public Lake Access Map
Making lake amenity information easier to access
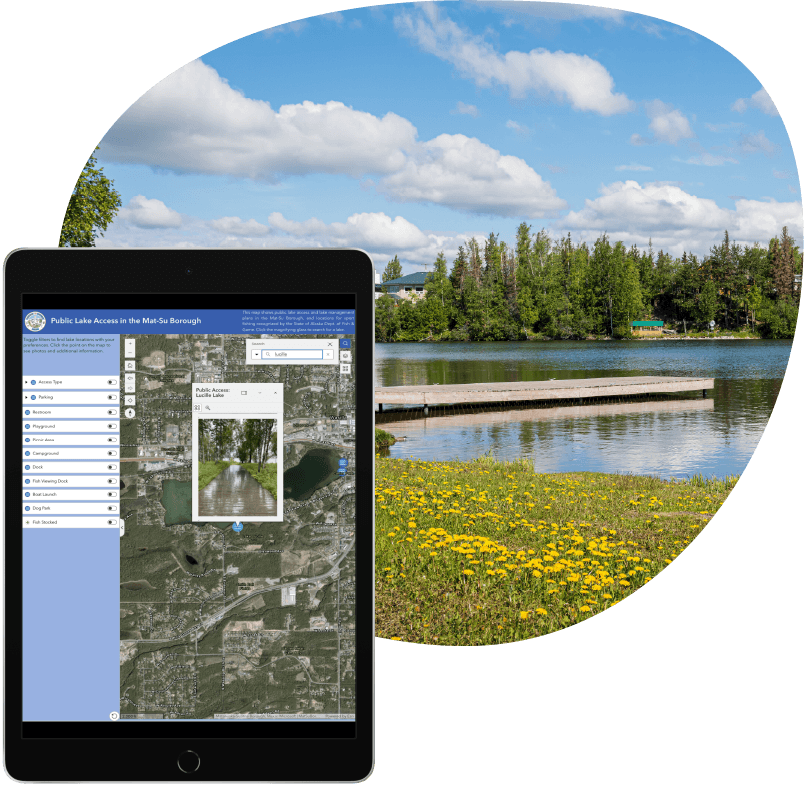
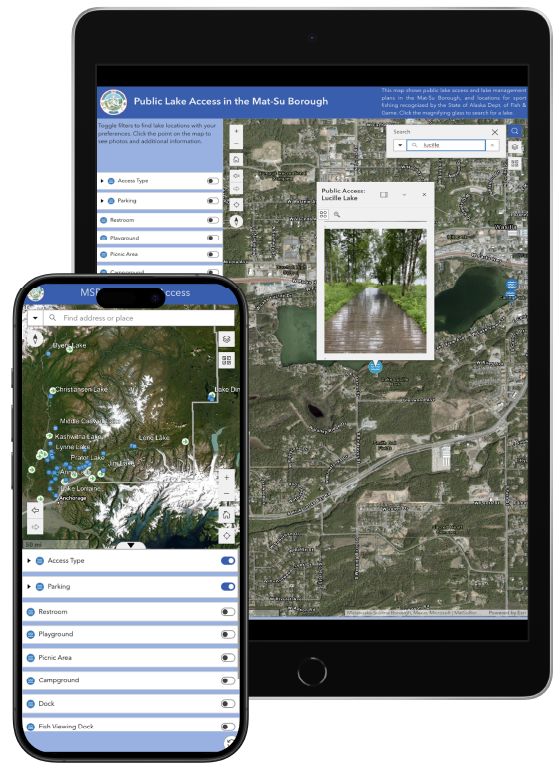
Mat-Su Borough is dotted with numerous lakes, each offering unique recreation opportunities. Previously, residents and visitors lacked a centralized source for data on lake access points, amenities, and regulations. Additionally, borough staff needed a better way to track and manage maintenance issues. To solve this, Resource Data partnered with MSB’s GIS team to develop the Public Lake Access Map, an interactive, visually rich Experience Builder app providing details on the lake’s facilities, its recreational guidelines, and clear directions to each lake.
Users can navigate the lake map to find boat launches, parking, restrooms, and trash receptacles, as well as fish stocking data, lake management plans, and regulations for activities like boating, ATV access, and ice fishing. The map includes photos and filters. Borough staff can also use the tool to track and address maintenance needs. Since its launch, the map has improved lake accessibility and conservation efforts, serving as a vital resource for outdoor enthusiasts and borough planners alike.
Driveway Permit App
Simplifying the driveway permitting process
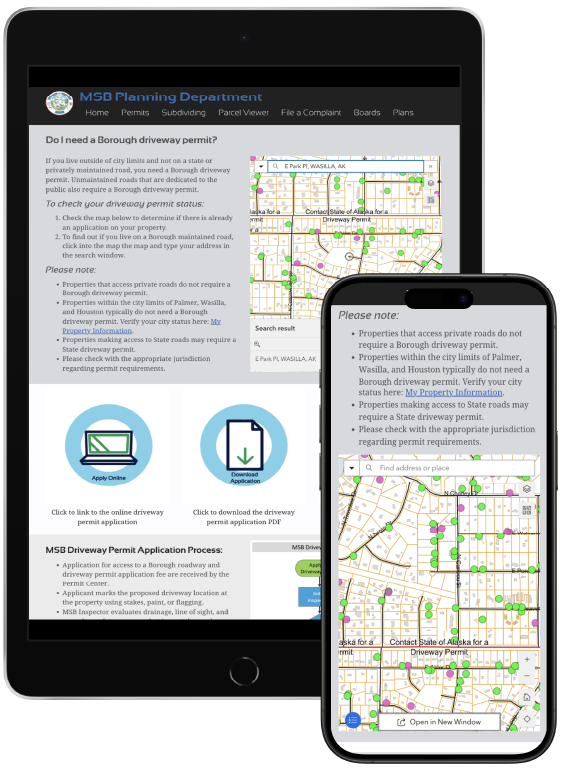
Previously, Mat-Su Borough citizens and staff relied on physical forms for driveway permits and inspections. Now, citizens can apply online, and staff in the field can enter site data via iPads, significantly accelerating approvals—one right-of-way inspector reported a 6-to-8-times speed increase. Staff can also use GIS tools to identify existing versus permitted driveways and notify those residents needing permits.
Resource Data supported MSB with this app by migrating the borough’s permit data to a new GIS-based model, creating spatial data, and developing a web app for multiple applications, including a field data app (Collector), a desktop entry app (Web AppBuilder), and a Workforce project for technician-to-inspector assignments. Finally, we built the public-facing component, configuring a secure GeoForm for permit submissions, and integrating with an online payment system. The new system streamlined permit management, made inspections faster, and enhanced public access to applications.

Results
A Sronger, More Connected Borough
Mat-Su Borough has transformed public access to geographic data, making land use, zoning, aerial imagery, and recreation information easily available through interactive maps. These tools have empowered residents, improved borough workflows, and strengthened public engagement by fostering transparency and collaboration.
By embracing GIS technology, Mat-Su Borough has been a nationwide leader in municipal GIS services, setting a new standard for community planning, infrastructure management, and environmental stewardship. These initiatives demonstrate the power of digital transformation, ensuring the borough can efficiently support its growing population and evolving needs.

What's Next
Building on a Foundation of Success
Mat-Su Borough continues to expand its GIS capabilities, focusing on long-range planning and infrastructure tracking. With Resource Data’s continued support, the borough is developing new tools to support data-driven decision-making and to leverage GIS to meet emerging challenges and serve its growing population effectively.




Case Study FAQ
A local government can do that by turning scattered GIS files, planning documents, and regulatory overlays into interactive public maps that people can search and use on their own time. The real improvement is making location-based information understandable enough that residents, developers, and property owners can answer common questions without depending on staff to assemble the information manually.
That matters even more in large or geographically spread-out jurisdictions, where getting to a government office can take hours and where residents may need answers before they decide whether to buy land, start a project, or request a permit. Broader public-sector planning guidance supports this pattern: interactive maps reduce common participation and access barriers by helping people explore place-based information remotely and at their convenience.
In Resource Data’s case study, Matanuska-Susitna Borough (Mat-Su Borough) previously stored GIS data in a file-based system that required formal requests and in-person pickup from Borough headquarters. Resource Data helped Mat-Su Borough move to a web-based GIS environment with dozens of public-facing apps, including a planning and land use viewer that consolidated zoning, service areas, flood zones, wetlands, school districts, and regulatory links in one place. In this example, interactive public maps improve access when they replace fragmented information requests with self-service tools. That helps with faster public decision-making, fewer staff interruptions, and better transparency around land use and planning.
They matter because growth increases the volume of public questions and the cost of answering them through manual staff workflows. As communities expand, more people need quick access to parcel information, zoning rules, facility locations, recreation details, service areas, and infrastructure conditions. If that information is hard to find, residents and staff will absorb the delay.
This is a wider local government trend, not just a Mat-Su story. Public-sector GIS research and planning guidance consistently frame interactive maps as a way to support broader participation, improve self-service, and reduce the friction that comes from location-based questions being handled by one person at a time. In fast-growing jurisdictions, interactive maps help communities scale access to information without adding to administrative burden.
Mat-Su Borough serves more than 250,000 residents across a vast area and needs to make geographic and planning data more accessible as the Borough continues to grow. The result was a gallery of 35 public-facing maps and apps supporting land use planning, issue reporting, recreation access, and more. This Resource Data case study demonstrates that interactive mapping is especially valuable in growth environments because it helps governments support more residents with faster, clearer, and more consistent information delivery.
Interactive map apps can solve public-service problems whenever location is central to the task, and the old process depends on too many phone calls, in-person visits, or back-and-forth clarification. In practice, that often includes reporting neighborhood issues, checking property constraints, reserving facilities, finding recreation access points, tracking permit needs, or understanding how regulations apply to a specific place.
That wider utility is one reason government GIS has become so important. Open GIS and digital-engagement research show that shared location data supports everything from planning and permitting public participation and infrastructure management. The public benefits from map visibility and faster, more intuitive access to services that are inherently place-based.
In Resource Data’s case study, Mat-Su Borough used interactive maps for planning and land use review, facility reservations, citizen problem reporting, public lake access, driveway permitting, and historic imagery access. Each app addresses a real service bottleneck rather than functioning as a generic map showcase. In this case study, interactive maps are most valuable when they solve everyday service problems tied to place. The benefits of Resource Data’s work include better self-service, less manual coordination, and more efficient Borough workflows across departments.
They reduce burden by moving routine information requests and repetitive intake tasks into public self-service workflows. When residents can search, filter, compare, and submit location-based information on their own, staff don’t spend as much time assembling data packets, answering basic “where” questions, or handling in-person requests.
This matters because many government teams are stretching thin, and public demand for faster digital access keeps rising. Public-sector GIS and open-data guidance point to shared, accessible geographic information as a way to avoid maintaining multiple copies of the same dataset or routing simple location questions through manual channels. Good public maps do not eliminate staff involvement, but they shift staff effort toward higher-value work.
In Resource Data’s case study, Borough staff previously had to gather and prepare GIS data when the public requested it. Later, tools like the Citizen Problem Reporter and Facility Reservations Map automated manual processes for residents and staff. This example shows that public maps can improve service and simplify internal operations at the same time and lead to lower administrative burden, faster task completion, and better use of staff resources.
A borough or county can improve engagement by giving people interactive, place-based tools that let them explore information in context instead of asking them to interpret static pages or attend meetings to get basic answers. For many residents, the barrier is not lack of interest. It is that the information is too hard to access, disconnected from location, or dependent on office hours and staff assistance.
That is consistent with broader local government engagement research. The Washington-based Municipal Research and Services Center (MRSC), a local-government research and guidance organization, notes that interactive maps can reduce barriers to participation by letting people explore issues tied to their location, schedule, and community needs in a more direct way. In other words, digital tools can make engagement more inclusive when they meet residents where they are.
In Resource Data’s case study, Mat-Su Borough’s public-facing maps gave residents easier access to planning data, public facilities, recreation information, lake rules, and issue-reporting tools. These tools strengthened public engagement by fostering transparency and collaboration. This case study illustrates that engagement improves when governments make local information easier to explore.
It takes more than publishing a few datasets online. A successful transition usually starts with GIS modernization work such as data inventory, data planning, moving file-based GIS data into enterprise geodatabases, and setting up a portal environment that can support multiple web apps over time. The real objective is to create a connected system that supports reuse, collaboration, and future growth rather than one-off map publishing.
Many governments have GIS data, but that does not automatically mean they have a public-ready GIS ecosystem. Shared public access depends on usable data structures, clear decision-making about which apps to build first, and enough internal coordination to support business needs across departments.
In Resource Data’s case study, Resource Data helped the Borough scope its enterprise environment, conduct data inventory and planning, move file-based GIS data to new enterprise geodatabases, install and configure its portal, and use a decision-tree process to determine which solutions to prioritize. This case study demonstrates that public-facing maps are strongest when they sit on top of a modernized GIS foundation. The results include better cross-department collaboration, more reusable data, and a stronger long-term platform for digital services.
A public map helps by consolidating the location-specific layers and rules people need into a single, searchable experience. Most residents, property buyers, and developers are not looking for “GIS data” in the abstract. They want to know what applies to a property, what restrictions matter, what service areas affect them, and what they should do next. If they have to cross-reference multiple sources manually, the process becomes harder and errors more likely.
This is where interactive maps have especially high public value. They can make complex regulatory information more understandable by tying it directly to an address or parcel. That is much more useful to most people than a collection of PDFs or separate web pages.
In Resource Data’s case study, the Planning and Land Use Viewer brought together zoning classifications, fire service areas, flood zones, school districts, wetlands, city boundaries, Borough code links, and external regulations in one ArcGIS Online-based tool. Resource Data’s example shows that interactive planning maps reduce confusion by connecting regulations to real places.
They work better because location is usually the missing context that staff need to act quickly and accurately. Generic forms and phone calls require follow-up just to determine where the issue is, what nearby conditions matter, or which facility the resident is asking about. A location-aware tool captures that context upfront and reduces back-and-forth.
This is one reason GIS-based public-service tools are so effective. They turn abstract requests into actionable, map-based records. That improves the experience for residents and staff members because both sides can work from a clearer, shared reference point.
In Resource Data’s case study, the Citizen Problem Reporter allowed residents to submit location-based reports about issues such as potholes, blocked roads, fallen trees, illegal dumping, and abandoned vehicles. The Facility Reservations Map lets residents explore facilities visually before moving into an online booking system. The Problem Reporter also integrated with the Borough’s internal work order system and showed a public dashboard for status tracking. In this case study, location-based service tools improve clarity and response. The operational impact is faster issue handling, less confusion, and a more convenient public experience.
A local government can do that by building map experiences around the real questions residents ask when they want to use public amenities: where do I go, what is there, what rules apply, and how do I know if this location fits my needs? Recreation information is often more useful when it is visual, filterable, and tied to place rather than presented as a static directory.
That aligns with broader public information trends. Governments are using interactive maps more, not only for planning and infrastructure but also for parks, lakes, trails, hazards, and community resources because these are services the public experiences geographically. A well-designed recreation map can reduce confusion and improve access at the same time.
In Resource Data’s case study, the Public Lake Access Map gave residents and visitors a centralized source for lake access points, amenities, regulations, management plans, fish stocking data, and directions. The map included filters, photos, and facility details such as boat launches, parking, restrooms, and trash receptacles. This case study shows that public maps can make recreation services easier to use while also supporting staff maintenance needs.
A successful program creates a more resilient way for the government to share information, coordinate across departments, and build future services on a reusable GIS foundation. The most important long-term value is not the number of apps alone. It is the shift from isolated datasets and manual processes to a connected digital ecosystem that can keep expanding as public needs evolve.
That is where the broader answer-engine opportunity sits, too. The deeper question behind this case study is not just “Should a government publish interactive maps?” It is “How can a government turn GIS into a durable public access and operations platform?” A strong mapping program answers that by showing how one GIS investment can support planning, recreation, permitting, reporting, public transparency, and internal coordination over time.
In Resource Data’s case study, Mat-Su Borough built a gallery of 35 interactive maps and apps and continues to expand its GIS capabilities for long-range planning and infrastructure tracking. The Borough strengthened public access, improved workflows, and enhanced engagement, and the GIS foundation is still growing. In this example, successful interactive mapping programs become long-term civic infrastructure. The impact is stronger scalability, better service continuity, and a more future-ready government information ecosystem.