



A Unified Air Quality System Delivers Near Real-Time Data Alerts
In Brief
New Platform Protects Public Health with Faster Air Quality Alerts
Air quality monitoring plays a vital role in protecting public health, especially in regions with heavy industrial activity. For the Texas Commission on Environmental Quality (TCEQ), serving over 25 million Texans, outdated technology and disconnected dashboards delayed vital public alerts.
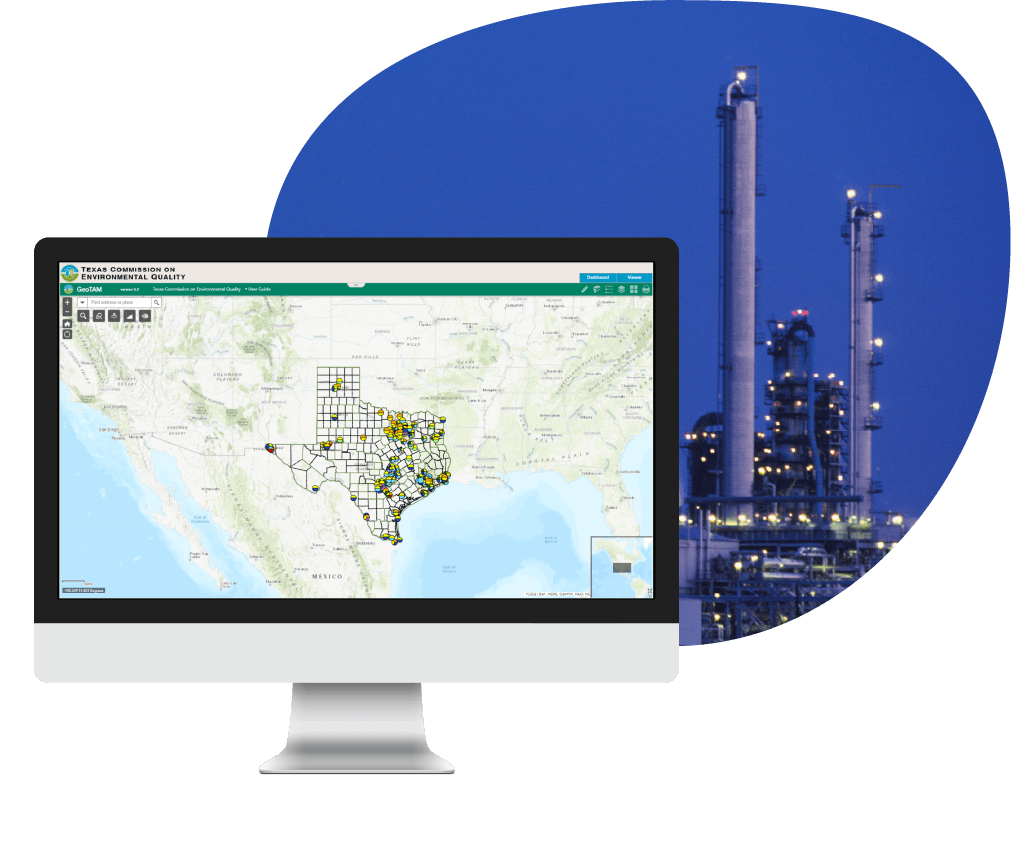
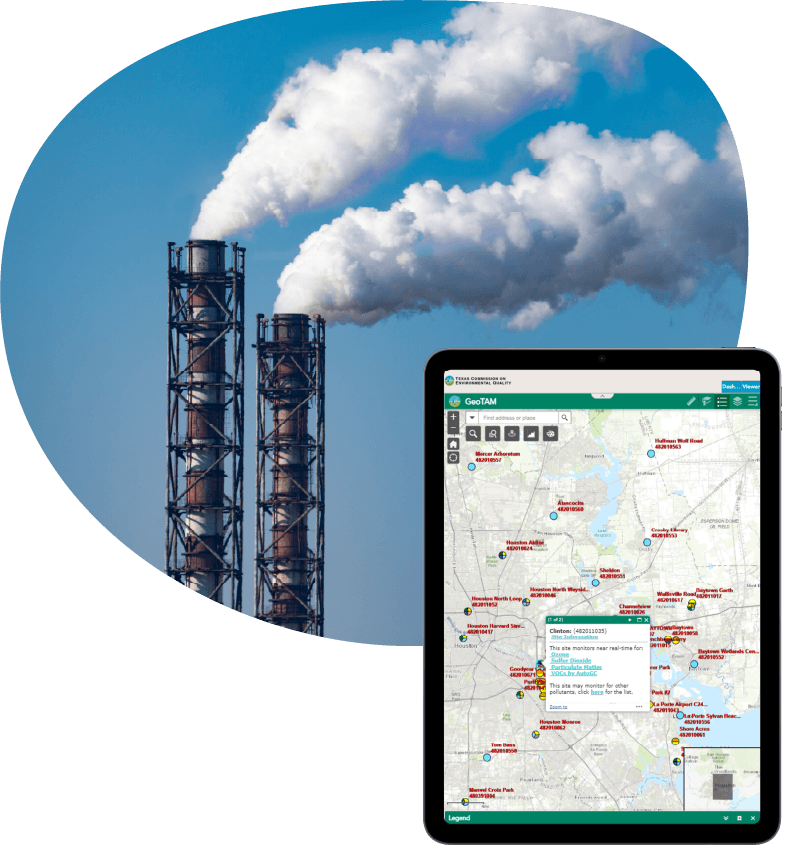
The new GeoTAM, built on Esri’s ArcGIS Experience Builder, replaced the legacy system with a single, unified application. The platform gives Texas communities near real-time access to environmental updates and reduces data latency from 24 hours to just 15 minutes.
Key Takeaways
Smarter Monitoring. Faster alerts.Stronger transparency.
-
Unified platform simplifies access to statewide data
By combining mapping and dashboard functions into a single interface, the public can easily visualize air quality data to identify unsafe conditions and researchers can run reports and track trends more efficiently.
-
Air Quality data latency reduced by 99%
The application reduced air quality refresh rates from every 24 hours to 15 minutes, enabling faster public alerts and stronger protection during hazardous events.
-
Historical records enable long-term research and compliance
GeoTAM contains records back to 2010, including information from decommissioned stations. This creates a comprehensive resource for long-term studies and regulatory reporting.
-
Transparent visualizations strengthen public trust
Updated mapping and visualization tools display accurate ambient air monitoring data in clear, accessible formats. By making risks easier to understand, TCEQ strengthens public trust and awareness in its reporting.
-
Configurable design enables future expansion
GeoTAM is a low-code application with built-in flexibility to expand into other environmental monitoring areas, such as water quality.

Our Client
TCEQ: Safeguarding Texas Air and Public Health
With over 2,800 employees, the Texas Commission on Environmental Quality (TCEQ) leads the state’s efforts to safeguard public health and natural resources through clean air, clean water, and safe waste management.
Within TCEQ, the Air Monitoring Division (AMD) operates one of the nation’s largest air monitoring networks, operating more than 200 monitoring stations spread across Texas’ vast 268,000 square miles. These stations collect critical data from areas with heavy industrial activity, such as refineries and chemical plants. AMD ensures accurate collection, analysis, and public reporting of air quality data, meeting federal reporting requirements while keeping communities informed.
Challenges
Outdated tools risked delayed alerts and limited awareness
The original Geographic Texas Air Monitoring (GeoTAM) system gave geospatial views of air quality data, but its technology had reached its limits. Built on Esri’s ArcGIS Web AppBuilder, scheduled for retirement in 2026, it lacked real-time data integration, a unified interface, and intuitive navigation.
Because the viewer and dashboard pulled separately from the Texas Air Monitoring Information System (TAMIS), staff and the public had to toggle between platforms to assemble a complete picture. Map visualizations offered only limited pollutant values, threshold levels, and monitoring locations, slowing analysis and communication.
Without modernization, TCEQ risked delayed reporting, incomplete datasets, and unreliable alerts during hazardous events—jeopardizing both public safety and trust.
The Solution
GeoTAM: A Unified System for Real-Time Air Quality Data
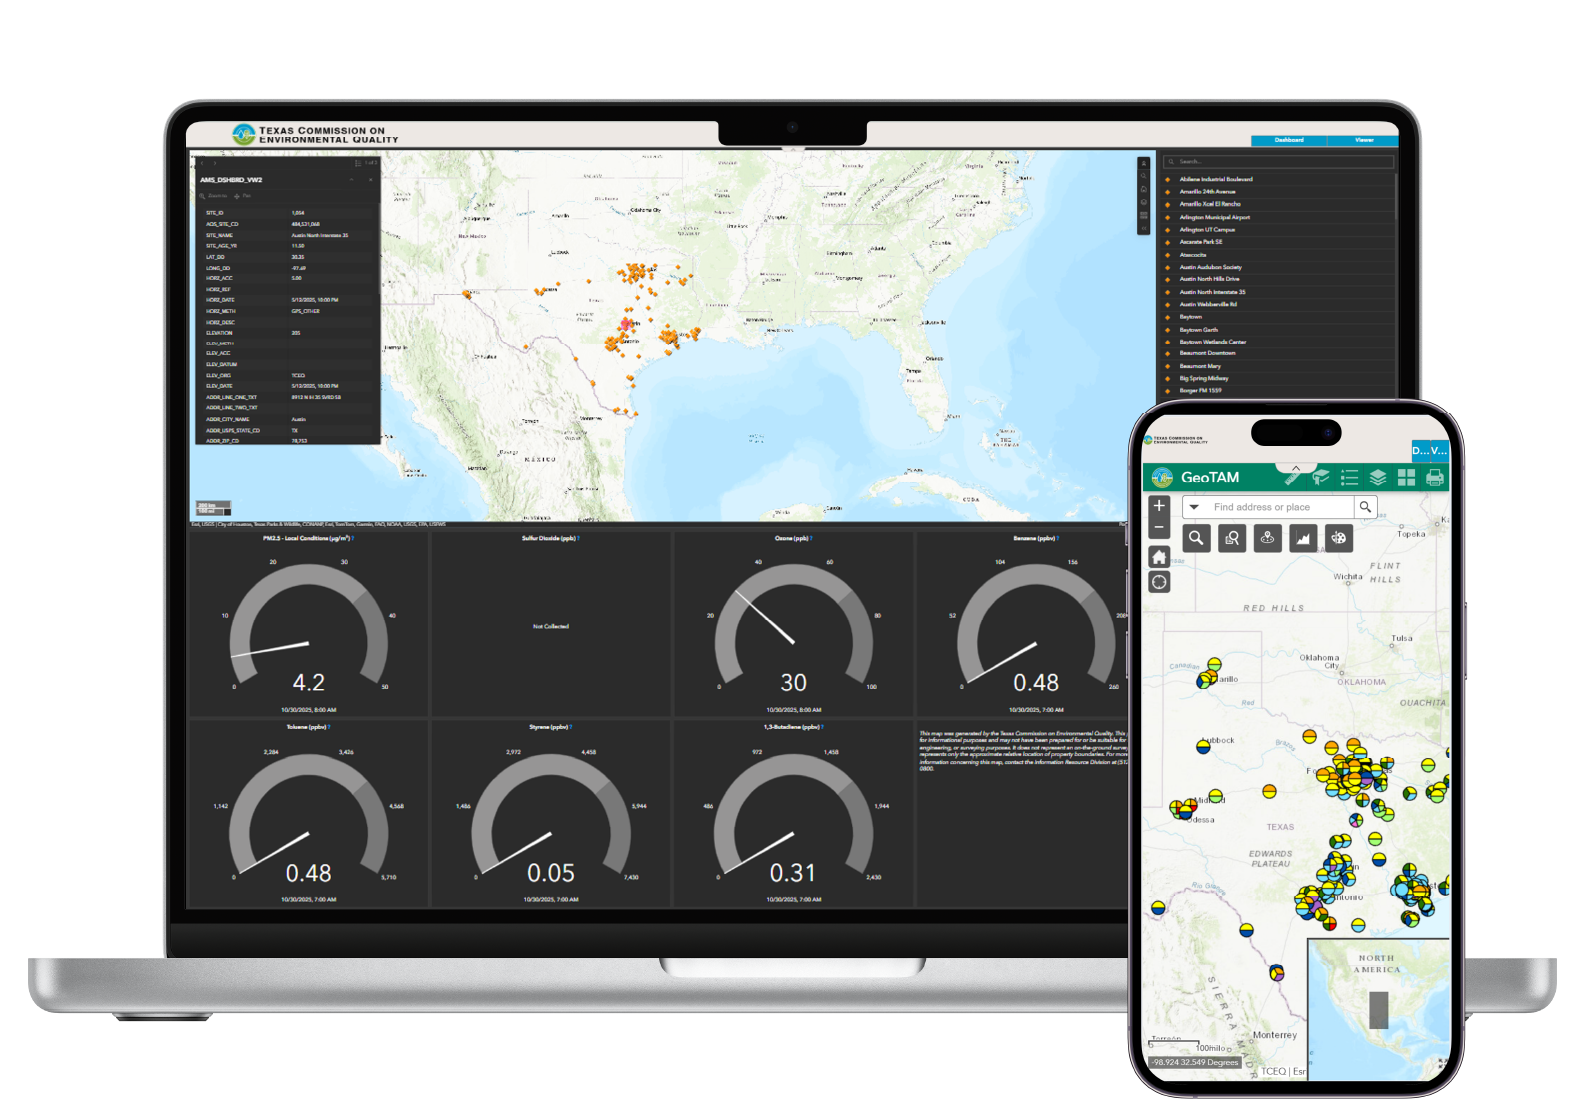
The new GeoTAM modernized TCEQ’s statewide monitoring system by unifying dashboards and maps into one application built on Esri’s ArcGIS Experience Builder. The system connects directly to the Texas Air Monitoring Information System (TAMIS), integrating data from more than 200 monitoring stations into a single interface.
Through this platform, the public, researchers, and TCEQ staff can access near real-time pollutant levels, compare values against thresholds, and explore historical records dating back to 2010.
This modernization gave TCEQ a unified, sustainable system that better protects public health, improves workflows, and prepares for future extension into other areas of environmental monitoring.
Features
Designed for clarity. Built for impact.
-
Interactive station pop-ups for detailed insights
Each monitoring station is clickable, displaying pollutant-specific values, thresholds, and site details. This transparency supports staff in communicating findings and helps the public understand localized air conditions.
-
Customizable multi-layered maps for easier exploration
Configurable map layers allow pollutant filtering, threshold comparisons, and updates without external support. Communities and staff can tailor views to focus on the regions and pollutants most relevant to their needs.
-
Historical records for stronger long-term analysis
With data going back to 2010, including decommissioned stations, GeoTAM creates a comprehensive record. Researchers and policymakers gain insights into long-term patterns to guide planning, compliance, and health protections.
-
Built-in guides for usability and adoption
Step-by-step user and application guides make the platform easy to navigate for both the public and staff. These resources reduce training time and ensure broad accessibility across diverse Texas communities.
Results
Faster Insights Build Public Trust and Safer Communities
The new GeoTAM delivers a single, unified platform for exploring and interpreting Texas air quality data. For the public and researchers, it provides a transparent, self-service experience that reduces reliance on manual requests and custom reports. For staff, it ensures a sustainable, streamlined system that supports long-term operations.
A significant breakthrough is the dramatic reduction in data latency—from 24 hours to just 15 minutes, a ~99% improvement. This near real-time reporting allows for faster public alerts and supports better awareness during environmental hazards.
What's Next
Scaling momentum across the organization
TCEQ can apply the same unified solution to other areas of environmental monitoring and build on the success of the new GeoTAM. With Esri’s ArcGIS Experience Builder already in place, they can easily replicate and adapt the platform for water quality and waste management insights when ready.



Case Study FAQ
An environmental agency should modernize before the old GIS app becomes a public-service risk. If the system provides public alerts, regulatory transparency, or emergency awareness, “still works today” is not enough. The agency has to ask whether the platform will still be supported, secure, maintainable, and usable as browsers and GIS tools keep changing.
That was the technical pressure behind Resource Data’s work for the Texas Commission on Environmental Quality (TCEQ). The original GeoTAM system was built on Esri ArcGIS Web AppBuilder. Esri’s documentation confirms that Web AppBuilder is being retired, with ArcGIS Online retirement phases extending through Q2 2027, and recommends migration to ArcGIS Experience Builder for new app work.
Resource Data rebuilt GeoTAM in ArcGIS Experience Builder. That gave TCEQ a modern application foundation while preserving the public purpose of the system: helping people view statewide air-monitoring data. TCEQ lowered its operational risk because it avoided leaving a public-facing air quality tool on aging technology.
This Resource Data case study shows that GIS modernization involves protecting the long-term reliability of systems that communities and agencies depend on.
An agency can make air monitoring data easier to use by connecting the source data system directly into one map-based dashboard. The public should not have to understand the agency’s internal data architecture. They should be able to see the monitoring station, pollutant readings, threshold context, and location information in the same place.
In the TCEQ case study, the older GeoTAM viewer and dashboard pulled separately from the Texas Air Monitoring Information System, or TAMIS. That meant staff and public users had to toggle between platforms to build a complete picture. Resource Data rebuilt GeoTAM so it connects directly to TAMIS and brings data from more than 200 monitoring stations into one ArcGIS Experience Builder application.
This matches a broader public-sector data pattern. TCEQ’s own air-monitoring page points users to GeoTAM for current ambient air quality values and TAMIS for generating and downloading monitoring data. The technical opportunity is to make those related data experiences feel connected instead of fragmented.
This solution led to faster interpretation. Researchers, staff, and residents can get closer to the answer without requesting custom reports or switching tools. Resource Data’s example shows how systems integration and GIS design can make complex environmental data more usable.
Reducing data latency from 24 hours to 15 minutes matters because air quality conditions can change faster than a once-a-day system can explain. For public health, outdated data can weaken alerts, slow responses, and make it harder for people to understand current air-quality risks.
Resource Data’s case study says the new GeoTAM reduced air-quality refresh rates from 24 hours to 15 minutes—roughly, a 99% improvement. TCEQ monitors areas with heavy industrial activity, including refineries and chemical plants, across a very large state. TCEQ’s public materials also describe GeoTAM as a way to view current ambient air values from monitoring sites.
The broader industry pattern is clear: public air-quality systems increasingly separate near real-time public information from fully validated regulatory data. EPA’s AirNow explains that its public-facing data receives preliminary quality checks but is not the same as fully certified regulatory data in EPA’s Air Quality System. That distinction matters. Near real-time data helps the public act quickly, while certified data supports formal regulatory determinations.
The impact is better public awareness without pretending that every live reading is final regulatory evidence. Resource Data’s GeoTAM modernization gives TCEQ a faster public communication layer while supporting deeper reporting and historical analysis.
A public air-quality dashboard can support both uses by making current readings easy to see while preserving historical records for deeper analysis. The system should help a resident understand what is happening now, but it should also help researchers and agency staff study patterns over time.
Resource Data’s GeoTAM work does both. The new application gives users near real-time pollutant levels and threshold comparisons. It also includes historical records dating back to 2010, including decommissioned stations. That historical layer is important because air-quality questions often require context. A single reading may raise concern, but long-term records show trends, recurring issues, and changes across monitoring locations.
This reflects a wider environmental data pattern. The EPA’s AirData tools and monitor maps help users explore monitor-specific information, though the EPA notes that its AQS database is not real-time and may lag data collection by months. In other words, environmental systems often need fast public data and durable historical datasets.
GeoTAM is an alerting interface and a research and compliance support tool. Resource Data’s case study shows how a GIS dashboard can serve immediate public awareness and long-term environmental planning from the same modernized platform.
A low-code GIS platform makes sense when an agency needs to move quickly, reuse patterns, and keep future expansion manageable. Environmental monitoring programs often share the same technical shape: locations, readings, thresholds, filters, maps, charts, historical records, and public guidance. A configurable platform lets teams build around that pattern without custom-coding every piece.
Resource Data used ArcGIS Experience Builder for TCEQ’s new GeoTAM. Esri describes Experience Builder as a low-code/no-code way to build web apps that interact with ArcGIS data, including responsive experiences for desktop, tablet, and mobile. That matters for a public environmental system because users may include staff, researchers, policymakers, and residents checking local conditions.
The case study also points to future reuse. TCEQ can apply the same unified approach to water quality and waste management when ready. The exact data and rules will differ, but the design pattern can carry forward: connect to the source system, show the data spatially, compare values against thresholds, preserve history, and guide users through the interface. Resource Data’s GeoTAM work created a repeatable technical model for environmental transparency across programs.
A state environmental agency can help residents by giving them access to air-quality information that updates much closer to real time. Daily reports are useful, but they can miss changes that happen during the day. When pollution levels shift, people need a way to check current conditions before they make decisions about outdoor activity, travel, or community safety.
In Resource Data’s case study, TCEQ needed to modernize GeoTAM, its public air monitoring platform. The older system refreshed air quality data every 24 hours. That delay made it harder to create fast public alerts during hazardous events.
Resource Data helped TCEQ launch a new GeoTAM system that updates air-quality data every 15 minutes. The platform gives the public, researchers, and agency staff a close-to-current view of pollutant levels across Texas. This has boosted public awareness. Residents can see conditions closer to when they are happening. TCEQ can communicate more quickly. Communities have a clearer way to understand environmental risk without waiting for next-day information.
A public air-quality platform should combine these tools because most people need the full picture, not scattered fragments. A map shows where monitoring stations are located. A dashboard shows data values. Station details explain what is being measured. When those pieces live in separate places, users have to work harder to connect them.
In Resource Data’s case study, TCEQ’s older GeoTAM system forced users to move between different map and dashboard tools. The viewer and dashboard pulled separately from the Texas Air Monitoring Information System (TAMIS). That made it harder for the public, researchers, and staff to understand conditions quickly.
Resource Data helped TCEQ replace that fragmented experience with a unified platform. Now, users can view monitoring locations, pollutant values, thresholds, and historical records from a single GeoTAM application.
This makes interpretation easier. Residents do not have to understand the agency’s internal systems to find useful information. Researchers can track trends more efficiently, and staff use a clearer public-facing tool. Resource Data’s case study shows how simplifying access can make complex environmental data more useful.
Easier access to air-quality data helps communities feel more informed because they can check conditions for themselves. That is especially important near refineries, chemical plants, and other industrial activity, where residents may have more questions about pollutants, monitoring locations, and public health risk.
In Resource Data’s case study, TCEQ’s Air Monitoring Division collects data from areas with heavy industrial activity across Texas. The agency serves over 25 million Texans and operates more than 200 monitoring stations. When that amount of data is hard to access or slow to update, the agency may lose public trust.
The new GeoTAM platform gives users near real-time access to pollutant levels, thresholds, station details, and historical records. TCEQ’s public air monitoring materials also show that GeoTAM helps users view current ambient air values from monitoring sites.
This improves transparency. Communities can see more of the information behind public air-quality reporting. They do not have to rely only on summaries or custom reports. This example shows how better data access can support trust, especially when environmental conditions are local, visible, and personally important.
A public environmental agency can serve both groups by designing the platform around two types of questions. Everyday residents often want to know what is happening now. Researchers need to understand what has happened over time. A strong air-quality system should make current conditions easy to see while keeping historical records available for deeper analysis.
Resource Data’s case study shows this balance in GeoTAM. The new system gives users near real-time pollutant levels and threshold comparisons. It also includes historical records dating back to 2010, including data from decommissioned stations.
That matters because the current reading only tells part of the story. Long-term records help users understand patterns, recurring conditions, and changes across monitoring locations. They can support research, planning, compliance, and policy conversations.
Residents get clearer about current information, and researchers and policymakers have a stronger record for long-term analysis. TCEQ gets one platform that supports immediate awareness and informed environmental decision-making. This case study shows how transparency can serve more than one audience when the system is designed thoughtfully.
One modernized air-quality platform can help an agency build momentum by creating a model that other programs can adapt to different needs. Many environmental data problems are similar. People need to know where something is happening, what the current values are, whether those values cross important thresholds, and how conditions have changed over time.
In Resource Data’s case study, TCEQ’s new GeoTAM platform was built with future expansion in mind. The case study notes that the same approach can be applied to other environmental monitoring areas, including water quality and waste management.
This is important because public agencies often manage many separate data systems. If each program has a different interface, access path, and reporting experience, the public has to relearn the process each time. A shared model can make environmental information easier to find and trust.
This leads to long-term efficiency and consistency. TCEQ can use GeoTAM as a foundation for broader transparency. Resource Data’s example shows how a modernization project like this can create a practical path for improving public access to information across an agency, not just inside one program.