



Centralizing Alaska’s Lake Data with an Interactive Map Viewer
Back to InsightsIn Brief
Alaska’s Division of Sport Fish faced difficulties in synthesizing insights about the state’s lake system due to fragmented data held in various locations. Resource Data developed a consolidated, centralized database and custom web application for the Division to access this data. The web application includes an interactive map that allows users, including the public, to filter and export data on Alaska’s lakes.
Challenge
Managing data for 1,300 lakes and answering related queries was daunting for the biologists in Alaska’s Division of Sport Fish due to the siloed nature of the data, which was scattered across multiple spreadsheets, databases, and paper files. Resource Data was approached to help identify and prioritize the Division’s needs. Consolidating lake-related data into a single database, accessible via a map-based interface emerged as the Division’s top priority.
Solution
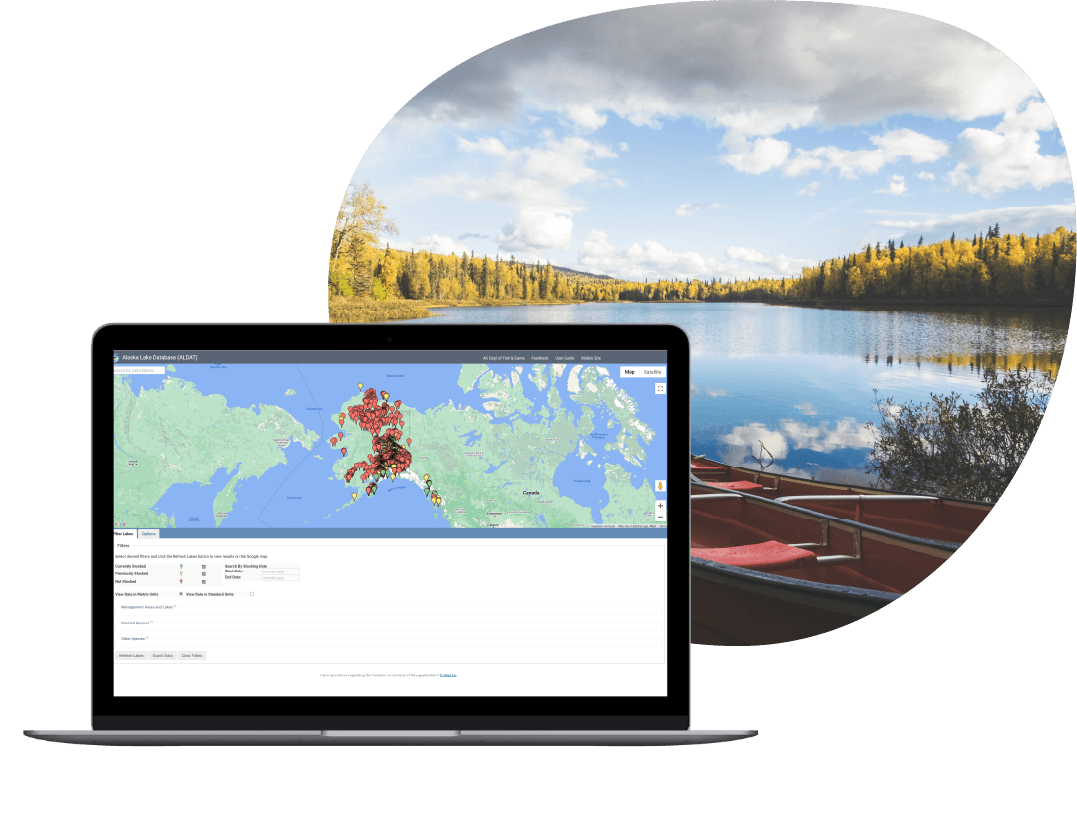
Resource Data designed a comprehensive database to store the Division’s lake-centric data, integrating it with other databases within the Alaska Department of Fish and Game (ADF&G). A custom web application was also built with both administrative and public components.
Through the administrative component, Division staff can:
- Maintain lake data
- Query and extract data for analysis and reporting
- View data using an interactive map
The public interactive map viewer, utilizing a Google Earth interface, offers features such as:
- Filtering lakes by criteria like species or stocking dates, aiding anglers in finding ideal fishing spots
- Exporting data
The new system, dubbed the Alaska Lake Database (ALDAT), has been well received, as noted in the Division’s You can also try out the site yourself here.
Approach
The project began with the development of architectural and database designs based on the Division’s existing SQL Server lake database. Enhancements included adding and reorganizing tables to support new datasets.
For the interactive map in the new web app, Google Earth was utilized per the Division’s request. The web app was developed using the ASP.NET Model View Controller (MVC) design pattern, enabling easier adaptation to ADF&G-mandated database and graphic design changes.
The project was executed using the Scrum methodology, with a Division staff member serving as a key Scrum team member and Product Owner. She prioritized user stories and tested each one thoroughly to ensure project success.





Case Study FAQ
A fish and wildlife agency can do that by moving fragmented lake information into one centralized database and pairing it with a map-based application that makes the data easier to search, view, and analyze. When important records live in multiple spreadsheets, disconnected databases, and paper files, staff spend too much time hunting for information instead of using it to support management, research, or public questions.
That matters because even good data becomes hard to trust or apply when it is siloed. Biologists and program staff need a way to see information in one place, compare records across lakes, and retrieve what they need without repeated manual effort.
In Resource Data’s case study, Alaska’s Division of Sport Fish was managing data for 1,300 lakes across multiple disconnected sources. Resource Data designed a consolidated database and custom web application so the Division could access lake-centric data through an interactive map interface. This Resource Data case study demonstrates that centralization improves both access and usability. The operational impact is less time spent searching, better data consistency, and a stronger foundation for analysis and reporting.
A map-based interface is valuable because lake questions are inherently geographic. Staff and public users often do not start with a table or record ID. They start with a location. A map lets people move from location to information much more naturally, whether they are trying to analyze stocking history, compare species presence, or simply find a lake that fits their fishing interests.
For public-facing use, that also lowers the barrier to entry. Most people are more comfortable exploring data visually than navigating complex datasets. For staff, the same interface makes it easier to relate records back to real geography and use the system for both analysis and communication.
In Resource Data’s case study, the Alaska Lake Database included an interactive map viewer that lets both staff and the public filter lakes and export information. Anglers could filter by criteria such as species or stocking dates to find suitable fishing locations, while Division staff could query and extract data for analysis and reporting. This Resource Data case study demonstrates that map-based access improves both professional and public use of complex environmental data. The operational impact is faster analysis, better public access, and more practical use of agency information.
It takes a system designed with separate but connected needs in mind. Internal staff need tools to maintain data, run queries, extract information, and support reporting. Public users need a simpler experience that helps them explore the information without exposing them to the full complexity of the agency’s internal data environment. A successful system supports both audiences without forcing either one into the wrong interface.
That balance is important because many agency systems work well for staff but are too technical for the public, or they work well for public viewing but do not support internal maintenance and analysis. A stronger design keeps the core data centralized while providing tailored experiences for different user groups. In Resource Data’s case study, the Alaska Lake Database included both an administrative component for Division staff and a public interactive map viewer. Staff could maintain and analyze lake data, while public users could filter lakes and export data relevant to their needs. This Resource Data case study demonstrates that a well-designed public resource platform starts with a shared data backbone and then adapts the interface to the audience. The operational impact is better internal efficiency and stronger public service without duplicating systems.
An agency can modernize responsibly by building on the useful parts of the existing environment instead of replacing everything from scratch. That usually means evaluating what already works, preserving valuable data structures, and enhancing or reorganizing the system to support new use cases and cleaner access. Modernization works best when it respects the institutional value already embedded in legacy systems while removing the limitations that keep those systems from being useful today.
This approach reduces disruption and helps agencies get more value from their existing investments. It also improves trust in the new system because staff can see that it is built on familiar, validated information rather than starting from scratch without context.
In Resource Data’s case study, the project began with architectural and database designs based on the Division’s existing SQL Server lake database, and the team enhanced that structure by adding and reorganizing tables to support new datasets. This Resource Data case study demonstrates that modernization can preserve legacy value while making the system more adaptable and accessible. The operational impact is lower reinvention cost, smoother adoption, and a better platform for future growth.
It makes a difference because agency staff bring the operational context that is practical and valuable in day-to-day operations. In custom data and mapping projects, success depends on understanding which workflows matter most, which questions users are really trying to answer, and what the agency will need to maintain and trust over time. Staff participation helps ensure those realities shape the final product.
That involvement also creates better feedback loops during development. When staff can prioritize user stories and test features as they are built, the project is more likely to stay aligned with real business needs rather than drifting toward developer assumptions.
In Resource Data’s case study, the project used Scrum methodology, and a division staff member served as a key Scrum team member and Product Owner. She prioritized user stories and tested each one thoroughly throughout the project. This Resource Data case study demonstrates that direct agency ownership improves fit, quality, and long-term usefulness. The operational impact is stronger alignment with real user needs, better testing feedback, and a more successful custom application.